
Session-Aware Strategy Stack: First Results from 3.5 Days of Paper Trading
Over the last week I restructured the system to be session-aware. Instead of running a single strategy across the entire day, the engine now splits trading into distinct time windows and assigns each window its own strategy set. Within every session I run three variants in parallel:
- prime — a hand-picked, balanced configuration
- pnl — the auto-selected configuration that produced the highest total PnL in backtests for that session
- score — the auto-selected balanced-score winner, where the score weights win rate × PnL × trade count
This structure lets me compare like-for-like behaviour across time-of-day and see quickly whether a session’s flow conditions support scalps, runner capture, or neither.
Experiment setup. Horizon ≈ 3.5 days; 207 trades across 103 tokens; position size 1 SOL/trade. Sessions: 00–08, 08–16, 16–24 (Europe/London). Variants: prime, pnl, score. All numbers below are from paper mode with the live engine’s execution logic.
Session Results
00–08 — thin flow, timeout-heavy, negative expectancy
Liquidity and participation are poor in this window and it shows up in the distributional stats and exit mix.
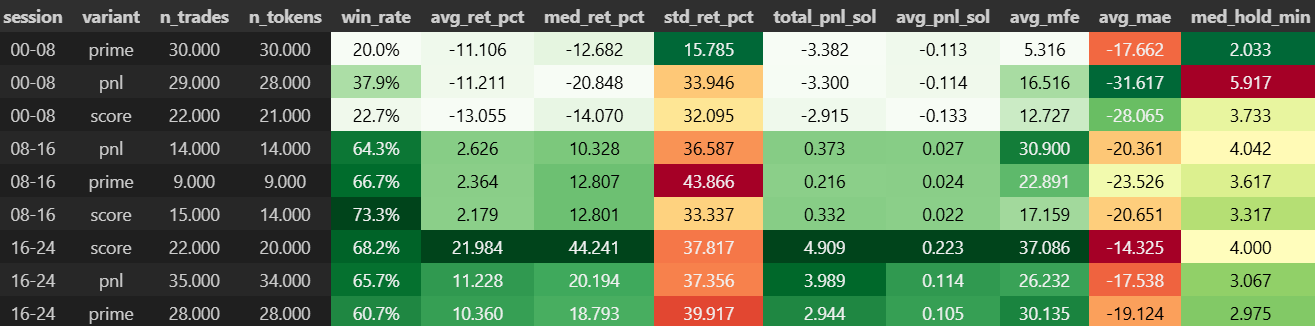
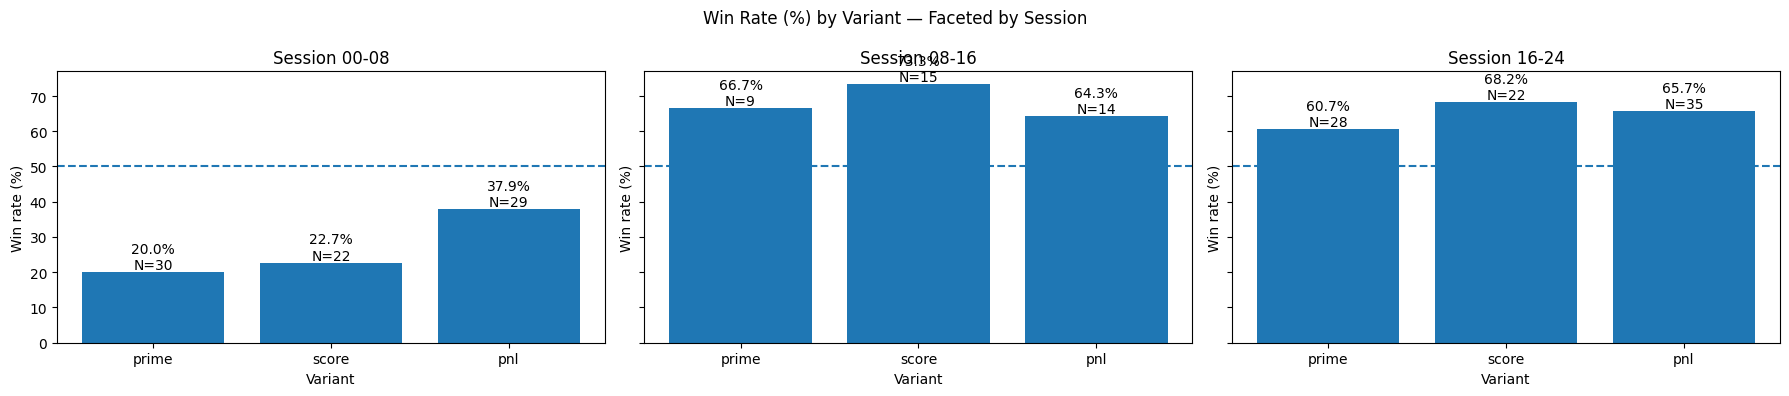
- Win rate: 20.0% (prime), 37.9% (pnl), 22.7% (score)
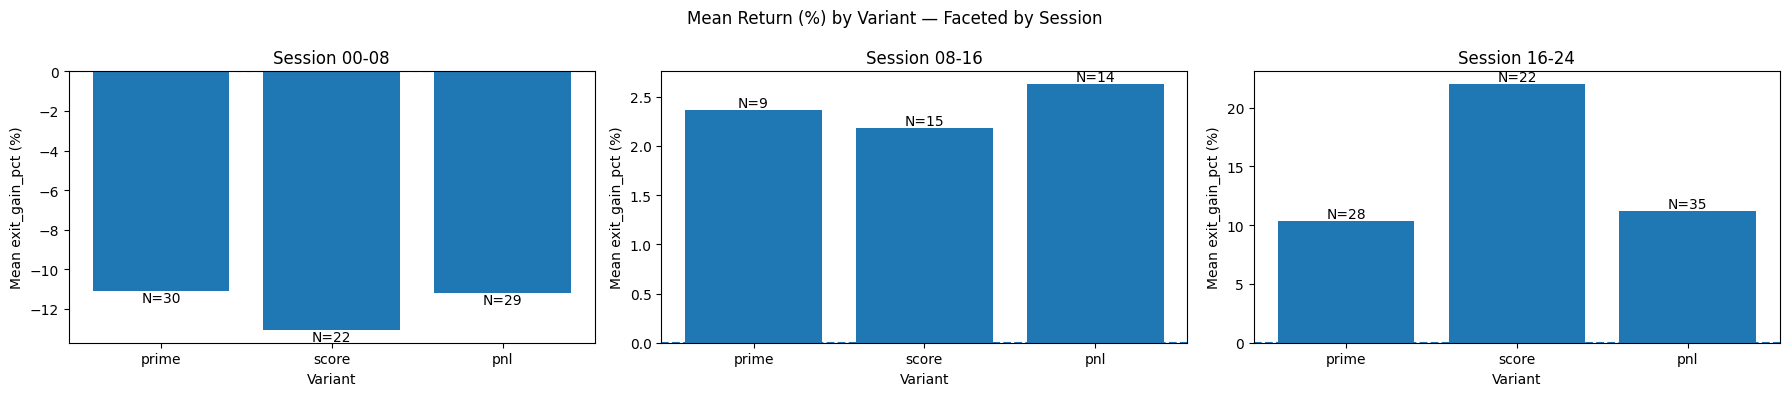
- Average return: −11.1%, −11.2%, −13.1%
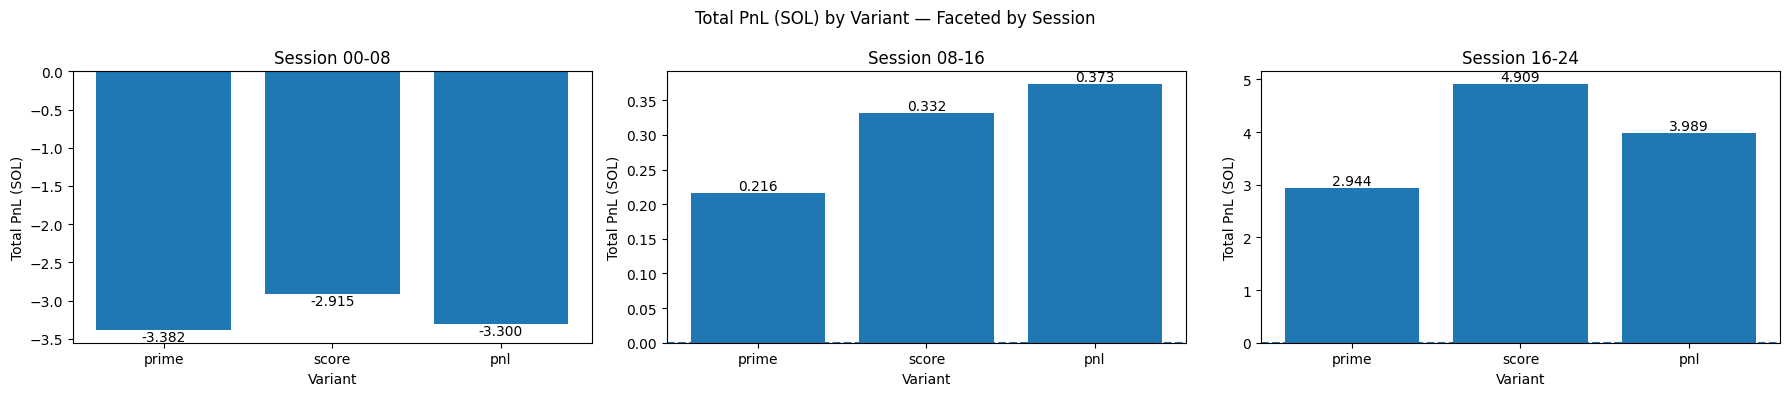
- Total PnL: −3.382 SOL, −3.300 SOL, −2.915 SOL
- MFE / MAE: 5.3% / −17.7% (prime), 16.5% / −31.6% (pnl), 12.7% / −28.1% (score)
- Median hold: 2.0–5.9 minutes; exits dominated by timeouts
Interpretation. Entries frequently stagnate and then time out; adverse excursions outweigh favourable ones (MAE ≫ MFE). Under current filters this session is structurally unprofitable and will remain research-only.
08–16 — modest edge, close to breakeven
Participation improves and so do outcomes, but the edge is still thin and noisy.
- Win rate: 66.7% (prime), 73.3% (score), 64.3% (pnl)
- Average return: 2.36% (prime), 2.18% (score), 2.63% (pnl)
- Total PnL: 0.216 SOL, 0.332 SOL, 0.373 SOL
- Std of returns: 43.9% (prime), 33.3% (score), 36.6% (pnl)
- MFE / MAE: 22.9% / −23.5% (prime), 17.2% / −20.7% (score), 30.9% / −20.4% (pnl)
- Median hold: ~3.3–4.0 minutes
Interpretation. The pnl variant converts opportunity most efficiently in this window (highest MFE with comparable MAE), but dispersion is high. If enabled live, this session gets conservative sizing and tighter guardrails.
16–24 — clear leader with favourable skew
Depth and genuine buy-side flow are consistently present; take-profit hits are common and adverse excursions are comparatively shallow.
- Win rate: 60.7% (prime), 65.7% (pnl), 68.2% (score)
- Average return: 10.36% (prime), 11.23% (pnl), 21.98% (score)
- Median return: 18.79% (prime), 20.19% (pnl), 44.24% (score)
- Total PnL: 2.944 SOL (prime), 3.989 SOL (pnl), 4.909 SOL (score)
- Avg PnL per trade: 0.105, 0.114, 0.223 SOL
- MFE / MAE: 30.1% / −19.1% (prime), 26.2% / −17.5% (pnl), 37.1% / −14.3% (score)
- Median hold: ~3.0–4.0 minutes; TP events become the plurality of exits
Interpretation. 16–24 is the production window. The score variant shows the best combination of win rate, positive median (not just mean), and “efficiency” (high MFE with relatively shallow MAE). The pnl variant offers breadth (35 trades) with solid expectancy; it’s a good secondary preset to carry alongside score.
Figures and tables
All figures for this study are collected below for convenience. Click any thumbnail to view the full-size chart; use arrows to navigate. Captions highlight the main takeaway of each plot.
- Figure 1. Session × Variant summary table: win rate, returns, PnL, MFE/MAE, and median hold times.
- Figure 2. Win rates by session and variant (dashed line at 50% benchmark).
- Figure 3. Total PnL (in SOL) segmented by session and variant.
- Figure 4. Mean returns (%) for each session and variant.
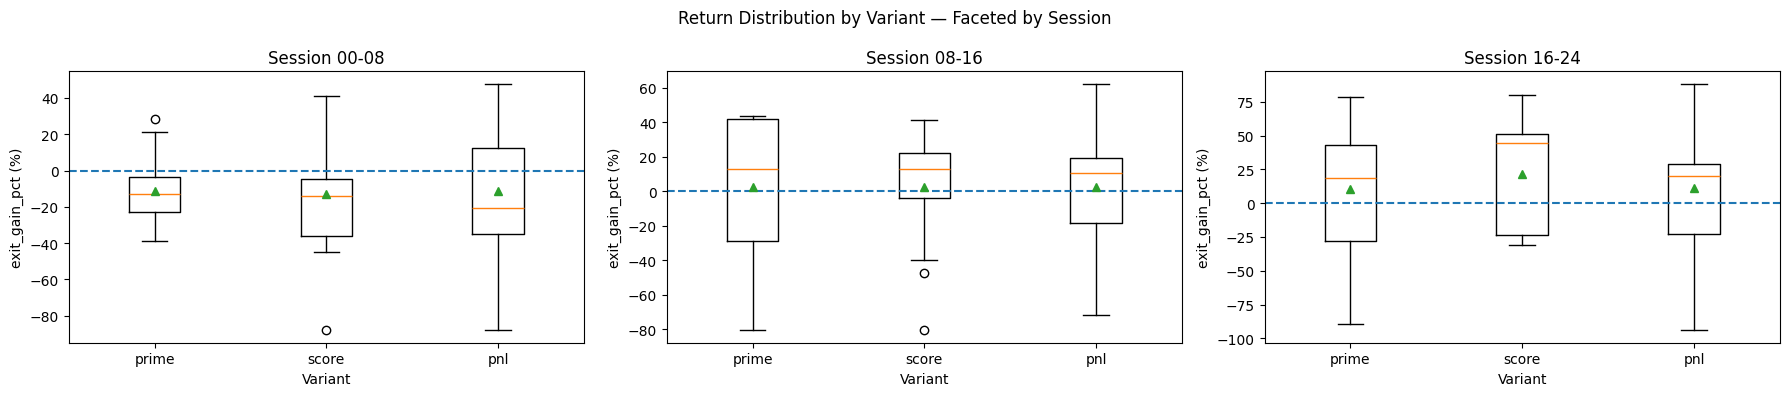
- Figure 5. Return distributions (boxplots), showing dispersion, skew, and median.
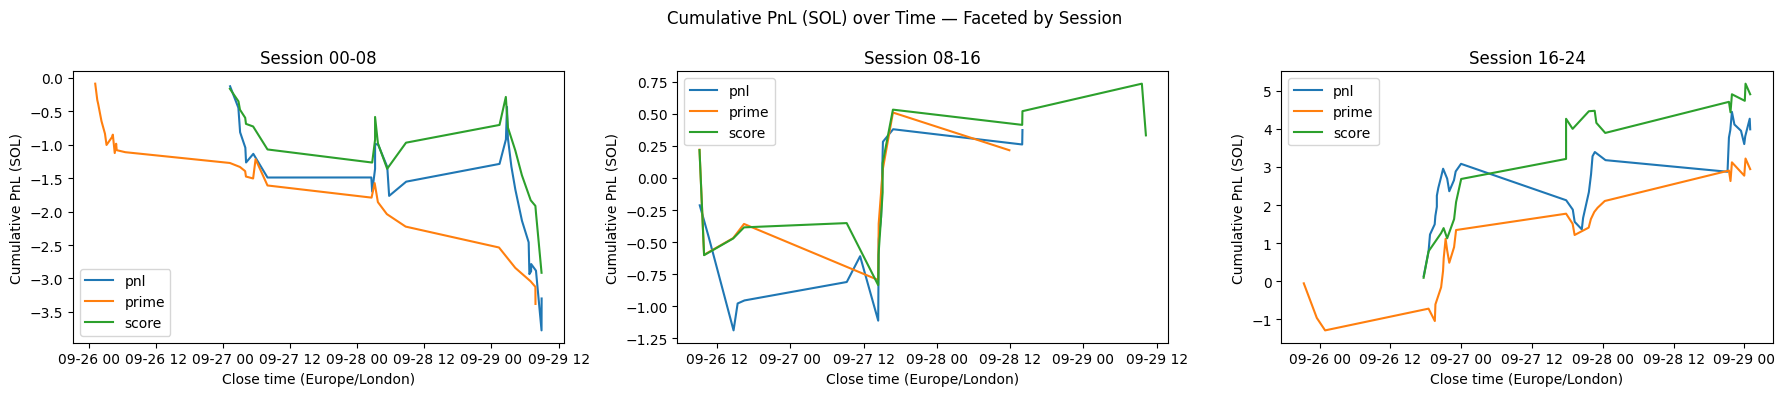
- Figure 6. Cumulative PnL curves over time, faceted by session.
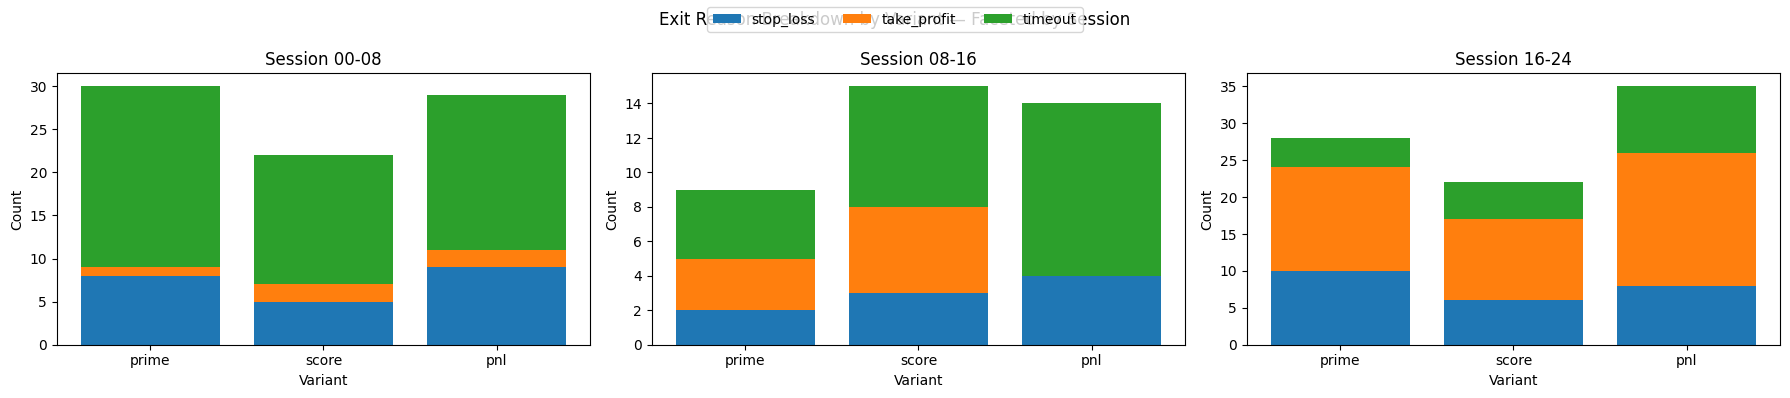
- Figure 7. Exit reason mix (take profit, stop loss, timeout) by session and variant.
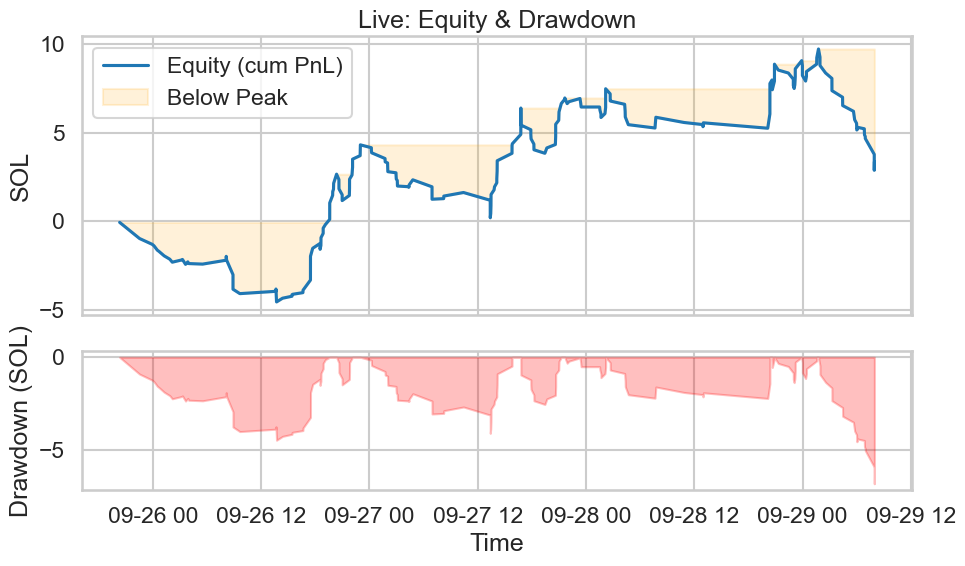
- Figure 8. Live cumulative PnL curve for reference against paper mode.
Efficiency and Robustness
Short windows can be deceptive, so I ran additional checks to judge stability and how well each variant turns opportunity into realized gains.
- Monte Carlo resampling (session × variant). Resampled trade sets to stress the rankings and tails; the 16–24 ordering remained stable.
- Shrinkage estimates. Small-N corrections on session-variant means to avoid over-rewarding low-count winners; conclusions unchanged.
- MFE/MAE efficiency. 16–24 score converts upside most cleanly (high average MFE with relatively shallow MAE), while 00–08 variants show the opposite pattern.
- Time-to-exit survival curves. 00–08 shows clustered timeouts; 16–24 sees faster TP hits and fewer late cuts.
- Regime sanity. Hour-of-day dominates; no single weekday effect.
I’ll publish the full tables and survival plots in a follow-up article, but the operational conclusion is straightforward: focus live risk on 16–24, keep 08–16 small and monitored, and leave 00–08 in research mode until filters and liquidity improve.
Next steps
- Promote 16–24 score to live rotation with existing risk caps.
- Continue session-specific grid searches for entries, exits, and trailing overlays.
- Publish the detailed appendices: Monte Carlo, shrinkage, MFE/MAE efficiency, and survival analysis.

